记录一下在刚结束的物联网检测项目中关于大屏这块的笔记。
包含的技术包括但不限于:vue3, echarts, echarts-gl,highechart,mqtt,unity-3d…
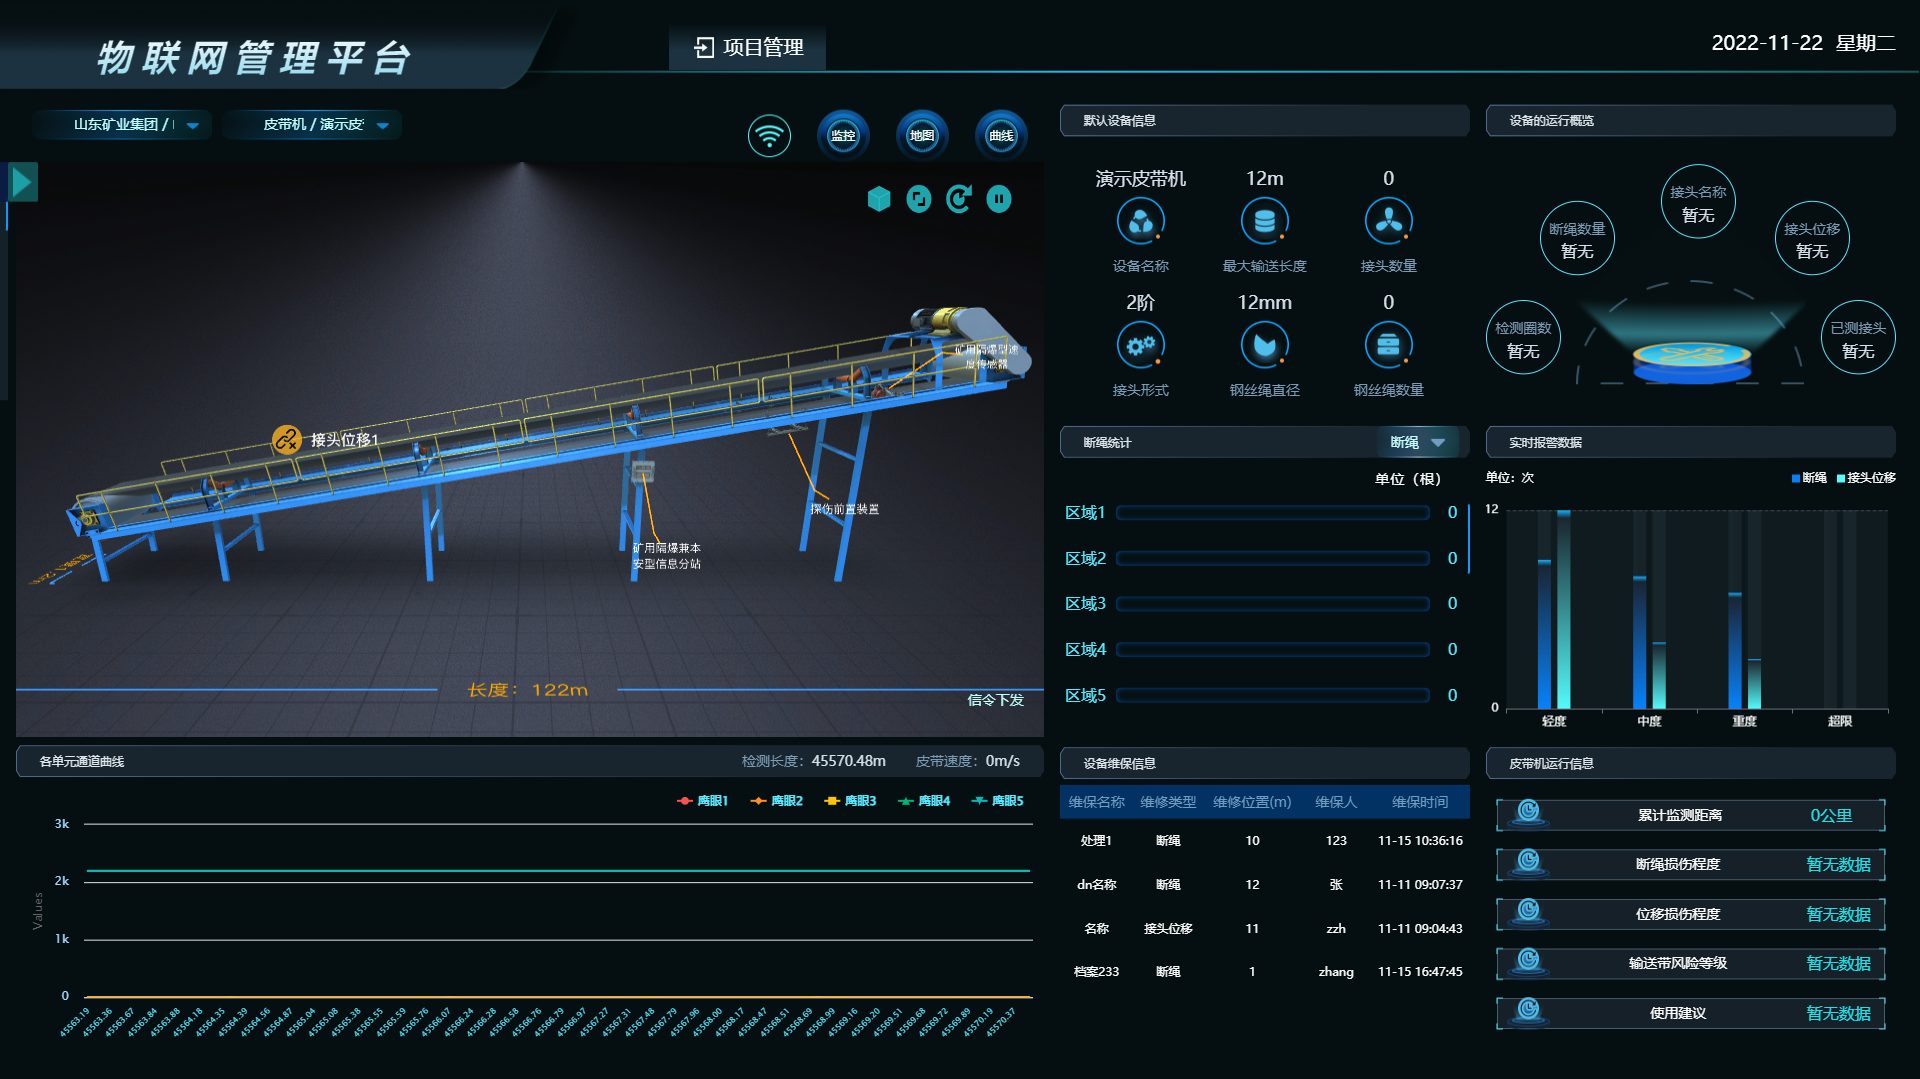
大屏自适应解决方案
据我检索到的资料来看,目前在大屏自适应这块表现不错的有两种方式: rem, transform: scale()
rem:
即相对于根元素字体大小的单位; 比如根元素字体颜色为24px; 此时子元素1rem相当于24px;
不推荐: 需要安装额外的插件库,并且需要额外的配置,以及需要将设计图px转为rem,相对来说有点麻烦,再一个在实际操作结果中表现并不理想【仅限个人】
scale:
scale是css3中的一个方法, 通过 transform: scale()来实现元素的缩放。即会按照给定的比例缩放当前元素。
推荐: 不需要安装额外插件库, 只需配置在页面发生变化时动态的设置元素缩放比例即可, 在实际项目中 结果表现理想,可很好的适应不同屏幕。
使用笔记:
设置layout容器,动态检测页面变化 实时设置元素缩放比例
<!-- layout/largeScreen.vue -->

<template>
    <div class="ScreenAdapter" :style="style">
        // router中使用, 作为组件时可不写此行
        <router-view />
    </div>
</template>

<!---->
<script lang="ts">
import {onMounted, reactive, onBeforeUnmount} from "vue";

export default {
    props: {
        width: {
            type: Number,
            default: 1920
        },
        height: {
            type: Number,
            default: 1080
        }
    },
    setup(props) {
        interface Style {
            width: string,
            height: string,
            transform: string,
        }
        const style:Style = reactive({
            width: props.width + 'px',
            height: props.height + 'px',
            transform: 'scale(1) translate(-50%, -50%)'
        })

        onMounted(() => {
           setScale()
            window.addEventListener('resize', Debounce(setScale, 300))
            // 设置根元素背景色和最小宽度
            document.getElementsByTagName('body')[0].style.minWidth = "auto"
            document.getElementsByTagName('body')[0].style.backgroundColor = "#050F11"
            document.getElementsByTagName('html')[0].style.minWidth = "auto"
            document.getElementsByTagName('html')[0].style.backgroundColor = "#050F11"
        })

        onBeforeUnmount(() => {
            // 恢复原本样子
            document.getElementsByTagName('body')[0].style.minWidth = ""
            document.getElementsByTagName('body')[0].style.backgroundColor = ""
            document.getElementsByTagName('html')[0].style.minWidth = ""
            document.getElementsByTagName('html')[0].style.backgroundColor = ""
        })

        function Debounce(fn, t) {
            const delay = t || 500
            let timer
            return function() {
                const args = arguments
                if (timer) {
                    clearTimeout(timer)
                }
                timer = setTimeout(() => {
                    timer = null
                    fn()
                }, delay)
            }
        }
        // 获取放大缩小比例
        function getScale() {
        const w = window.innerWidth / props.width
        const h = window.innerHeight / (props.height + 9)
        return [w, h]
    }

        // 设置比例
        function setScale() {
            style.transform = 'scale(' + getScale()[0] + ',' + getScale()[1] + ') translate(-50%, -50%)'
            console.log('任你千变万化,我都不会影响性能')
        }

        onBeforeUnmount(() => {
            window.removeEventListener('resize', Debounce(setScale, 100))
        })

        return {style}
    }
}
</script>
<style lang="scss" scoped>
.ScreenAdapter {
    transform-origin: 0 0;
    position: absolute;
    left: 50%;
    top: 50%;
    transition: 0.1s;
    color: #D7E1EA;
    background-color: #050F11;
    -webkit-font-smoothing: subpixel-antialiased;	//字体抗锯齿
    overflow: auto;
}
</style>
在页面中实践
可将
largeScreen.vue作为组件使用<largeScreen> 大屏内容 </largeScreen>可将
largeScreen.vue作为router中的component使用// vue-router { path: '/largeScreen', redirect: '/largeScreen/index', component: largeScreenLayout, children: [ { path: '/largeScreen/index', name: 'largeScreenIndex', component: () => import('./index/index.vue'), }, ] } // ./index/index.vue <template> 大屏内容 </template>
mqtt初识
mqtt是基于客户端-服务端的消息发布/订阅传输协议;
我的理解是:类似于websocket的即时传输的一种。
MQTT百度百科:https://baike.baidu.com/item/MQTT/3618851?fr=aladdin
推荐npm库/文档: https://www.npmjs.com/package/mqtt/v/1.1.2
使用笔记:
在vue3中使用:
<script setup lang="ts">
import {onBeforeUnmount, onMounted, reactive} from "vue";
import * as mqtt from "mqtt/dist/mqtt.min";

const chartConfigData = reactive({
    matt: null
})


// 连接mqtt
function mqttConnect() {
    let options = {
        username: "admin",
        password: "admin",
        cleanSession : false,
        keepAlive:60,
        clientId: 'mqttjs_' + Math.random().toString(16).substr(2, 8),
        connectTimeout: 4000
    }
    let client = mqtt.connect(‘mqtt地址’, options);
    // 监听连接并订阅
    client.on("connect", (e)=>{
        //订阅三个名叫'top/#', 'three/#'和'#'的主题
        client.subscribe(['主题名称'], { qos: 1 }, (err)=> {
            if (!err) {
                console.log("订阅成功");
            } else {
                console.log('消息订阅失败!')
            }
        });
    });
    // 结束连接
    client.on("end", (e) => {
        console.log('end', e)
    })
    // 重连
    client.on("reconnect", (e) => {
        console.log('reconnect', e)
    })
    // 监听消息
    client.on("message", (topic, message) => {
        console.log(message)
    })
    chartConfigData.mqtt = client
}

// 断开当前mqtt连接
function mqttDisconnect() {
    chartConfigData.mqtt.end()
    chartConfigData.mqtt = null
}


onMounted(() => {
    // 加载组件时:进行连接 订阅
    mqttConnect()
})
onBeforeUnmount(() => {
    // 卸载组件时: 断开链接
    mqttDisconnect()
})

</script>
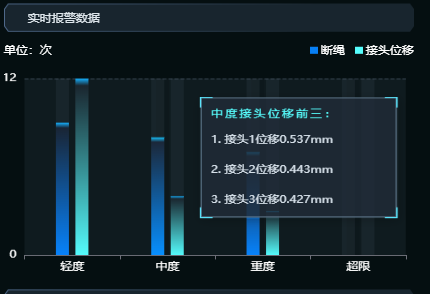
echarts 初步使用
echarts文档: https://echarts.apache.org/zh/option.html#title
以实现柱形图为例:
<template>
    <div id="warringEcharts" style="width: 100%; height: 250px"></div>
</template>

<script setup lang="ts">
import {onBeforeUnmount, ref} from "vue";
import * as echarts from "echarts";

const EchartsRef:any = ref(null);

const initEcharts = () => {
    let dom:any = document.getElementById("warringEcharts");
    let Echarts =  echarts.init(dom);
    let options = {
        backgroundColor:"#050F11",	// 背景色
        grid: {	// echarts四周间距
            top: '10%',
            bottom: '10%',
            left: '5%',
            right: '2%',
        },
        dataset: {
            dimensions: ['product', '断绳', '接头位移'],
            source: [
                { product: '轻度', "断绳": 0, "接头位移": 0 },
                { product: '中度', "断绳": 0, "接头位移": 0 },
                { product: '重度', "断绳": 0, "接头位移": 0},
                { product: '超限', "断绳": 0, "接头位移": 0}
            ]
        },
        xAxis: { type: 'category',
            splitArea: {
                show: true,
                areaStyle: {	// 每组背景色
                    color: ['#6C8297',], //这里重点,用于设置颜色的数组,
                    opacity: .1,
                }
            },
            axisLabel: {	// x轴字体颜色
                color: '#fff'
            }
        },
        yAxis: {
            splitLine: {	// 柱状图y轴分割线样式
                show: true,
                lineStyle: {
                    type: 'dashed', //默认实线,dashed虚线
                    width: 1,
                    color: '#35414D',
                }
            },
            axisLabel: {	// y轴字体颜色
                color: '#fff'
            },
            interval: 20,
        },
        tooltip: {		// 鼠标点击或click 弹窗
            trigger: 'item',
            triggerOn: 'click',		// 支持 hover 和 click,
            padding: 0,
            backgroundColor: 'rgba(0,0,0,0)',
            borderWidth: 0,
            formatter(params,ticket,callback) {
                console.log(params)
               // 异步获取数据需要 callback, 同步直接return
                beltWarringTop(_params)
                .then(res => {
                    let _content = ""
                    el = `
<div style="background: url('/popoverBg.png') no-repeat; background-size: 100% 100%;width: 200px; height: auto;padding: 6px 12px">
    <div style="color:#56FDFD; font-size: 12px; letter-spacing: 0.18em; line-height: 2;">${params.name}${params.seriesName}前三:</div>
    内容233
</div>`
                    callback(ticket, el)
                })
                return "loading"
            }
        },
        series: [
            {	// 详见echarts 柱状图文档
                type: 'bar',
                barWidth: '13px',
                barMaxWidth: '50px',
                showBackground: true,
                backgroundStyle: {	// 背景色
                    color: '#6C8297',
                    opacity: '0.1',
                    shadowOffsetX: 100,
                },
                barGap: '50%',
                itemStyle: {	// 柱状图颜色 渐变
                    color: new echarts.graphic.LinearGradient(0, 1, 0, 0, [
                        { offset: 0, color: '#0782FA' },
                        { offset: .96, color: '#192535' },
                        { offset: 1, color: '#15B1FF' }
                    ])
                },

            },
            {
                type: 'bar',
                barWidth: '13px',
                showBackground: true,
                backgroundStyle: {
                    color: '#6C8297',
                    opacity: '0.1',
                },
                barGap: '50%',
                itemStyle: {
                    color: new echarts.graphic.LinearGradient(0, 1, 0, 0, [
                        { offset: 0, color: '#54FAFB' },
                        { offset: .96, color: '#1A262F' },
                        { offset: 1, color: '#15B1FF' }
                    ])
                },
            }
            ]
    }
}


// 销毁echarts
onBeforeUnmount(() => {
    if (EchartsRef.value) {
        EchartsRef.value.dispose()
        EchartsRef.value = null
    }
})

</script>
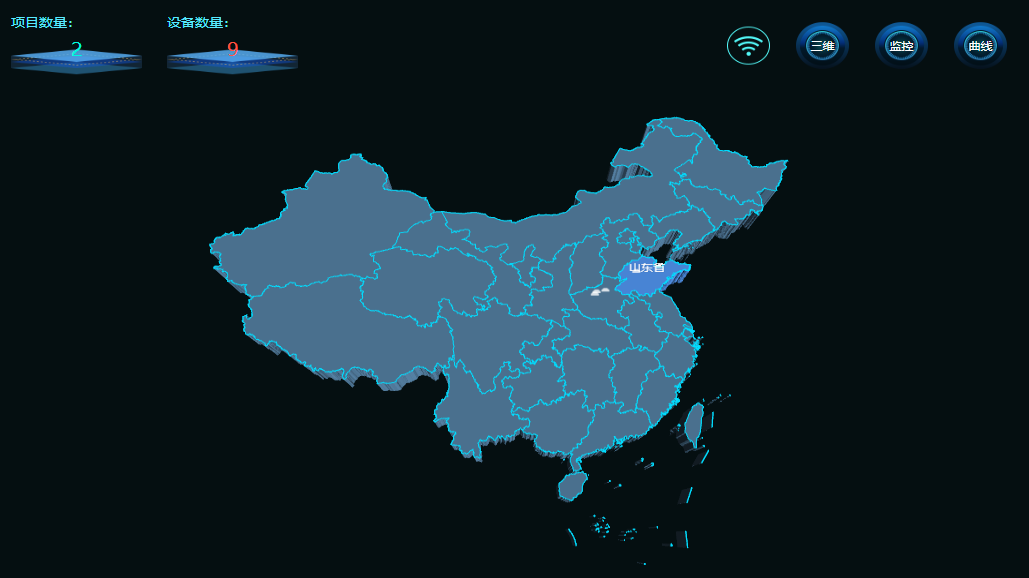
echarts 绘制geo地图
首先下载geojson数据: https://datav.aliyun.com/portal/school/atlas/area_selector#&lat=33.521903996156105&lng=104.29849999999999
将下载的json放到项目目录中。
echarts-gl文档: https://echarts.apache.org/zh/option-gl.html#geo3D
import * as echarts from "echarts";
import "echarts-gl";

    let MapEl:any = document.getElementById("map")
    let map:any = echarts.init(MapEl);
    // 引入地图数据
    const chinaJson:any = await import(`@/assets/json/china.json`)
    echarts.registerMap('china', chinaJson) //注册可用的地图

    let option = {
        geo3D: {
            roam: true,
            map: "china",
            viewControl: {
                alpha: 68,
                beta: 0,
                autoRotate: false,
                center: [0, 0, -10,]
            },
            // boxDepth: 100,//地图倾斜度
            regionHeight: 5,//地图厚度
            label: {
                show: false,
                position: 'center',
                formatter: (p) => p.name,
                textStyle: {
                    color: '#ffffff', // 地图初始化区域字体颜色
                    fontSize: 14, // 字体大小
                    opacity: 1, // 字体透明度
                    backgroundColor: 'rgba(0,23,11,0.5)' // 字体背景色
                },
            },
            shading: "lambert",
            itemStyle: {
                color: '#5885A9',
                borderColor: '#00DDFF',
                borderWidth: 1,
            },
            emphasis: {
                disabled: true,
                itemStyle: {
                    color: '#569DFB',
                    borderColor: '#6BECF5',
                    borderWidth: 30,
                },
                label: {
                    show: true,
                    color: '#fff'
                }
            },
            center: [106.97, 34],
            hoverAnimation: true, //是否开启鼠标 hover 的提示动画效果
        },
        series: [
            {
                type: 'scatter3D',
                coordinateSystem: 'geo3D',
                data: scatter,		// 在地图上标点数据
                zlevel: 20,
                rippleEffect: { //涟漪特效
                    period: 20, //动画时间,值越小速度越快
                    brushType: 'stroke', //波纹绘制方式 stroke, fill
                    scale: 4 //波纹圆环最大限制,值越大波纹越大
                },
                label: {
                    normal: {
                        show: false,
                        position: 'right', //显示位置
                        offset: [5, 0], //偏移设置
                        formatter: function(params) { //圆环显示文字
                            return params.data.name;
                        },
                        fontSize: 18
                    },
                    emphasis: {
                        show: true,
                        color:'#fff',
                    }
                },
                symbol: 'circle',
                symbolSize: 8,
                itemStyle: {
                    color: '#fff'
                },
            }
        ]
    }
    map.setOption(option)
highechart使用
简单图表使用
待续…
结合mqtt做动态曲线图
待续…
unity 3d模型结合vue
待续…
vue3中 watch, props等API使用笔记
watch:
import { watch } from "vue";

watch(() => data, (newVal, oldVal) => {
    console.log(newVal, oldVal)
})
props:
const props = defineProps({
    data: {
        required: true,
        type: Object||undefined,
        default: () => {
            ...
        }
    },
})
注:待续部分 回头有闲工夫了再更新吧~ 嘿嘿 自由不羁 随心所欲
有问题请联系:zhanghaoran.ren@qq.com